To monitor system performance in Linux, you can use several built-in command-line tools and techniques:
1. top Command
The top command provides a real-time, dynamic view of system processes and resource usage[1][4]. It displays information on CPU, memory, and running processes. To use it:
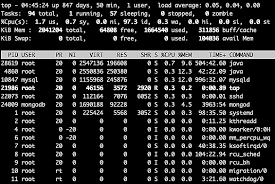
top2. htop Command
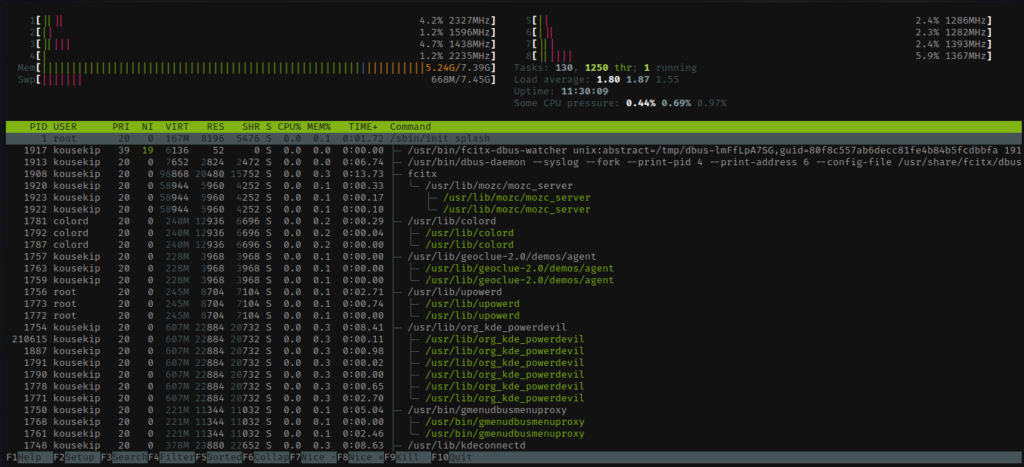
htop is an enhanced version of top with a more user-friendly interface[4]. Install it using:
sudo apt-get install htopThen run it with:
htop3. vmstat Command

vmstat monitors virtual memory statistics, including swap usage and system operations[4][7]. Use it with:
vmstat 5This will display updates every 5 seconds.
4. iostat Command
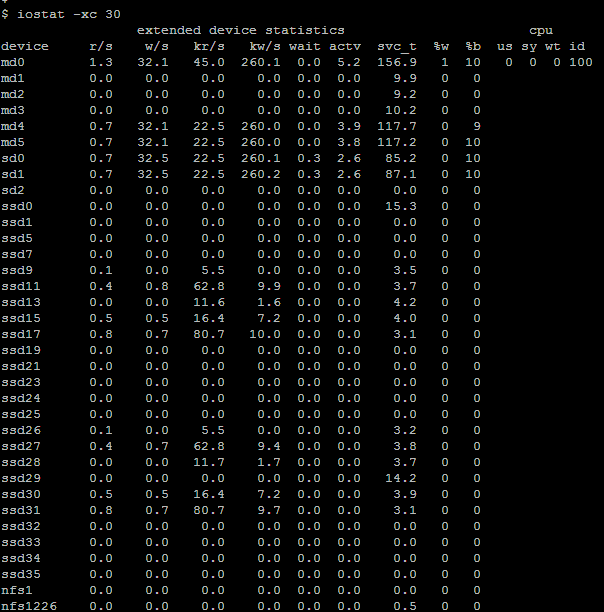
iostat provides CPU statistics and input/output statistics for devices and partitions[4][7]. Run it with:
iostat 55. free Command

The free command shows memory usage information[4]. Use it with the -h flag for human-readable output:
free -h6. sar Command
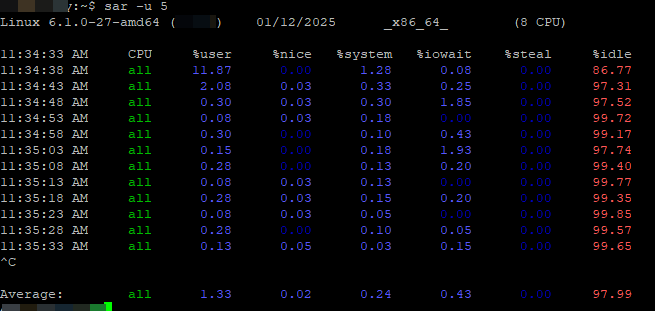
The System Activity Reporter (sar) is useful for monitoring CPU performance over time[10]. Use it with:
sar -u 5This will show CPU utilization updated every 5 seconds.
If not installed in your distribution you will need to install the sysstat package:
sudo apt-get install sysstat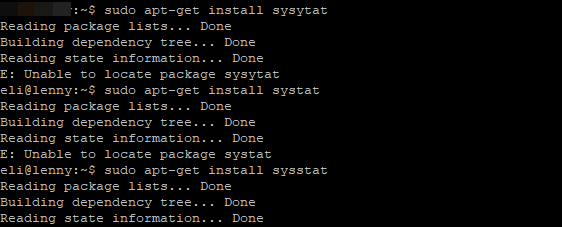
7. netstat Command
netstat displays network connections and routing tables[4]. Use it to monitor network activity:
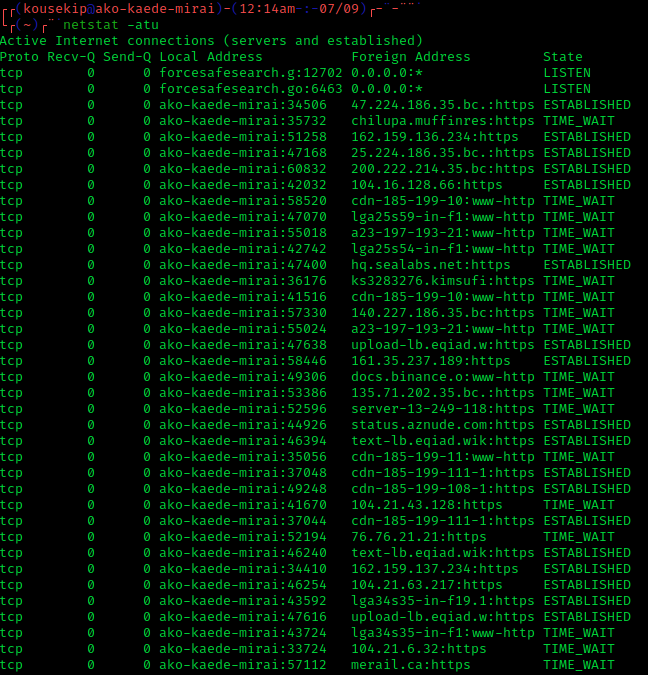
netstat -aBest Practices
- Establish baseline performance metrics for your system[9].
- Set up alerts for critical thresholds[15].
- Regularly review and adjust monitoring parameters[9].
- Use a combination of real-time monitoring and historical data analysis[1].
- Consider using more advanced monitoring tools like Sematext or Monitorix for comprehensive system oversight[5][8].
By using these tools and following best practices, you can effectively monitor and maintain optimal performance of your Linux system.
Citations:
[1] https://www.geeksforgeeks.org/linux-system-monitoring-commands-and-tools/
[2] https://serverauth.com/posts/linux-performance-monitoring-a-comprehensive-guide
[3] https://signoz.io/guides/linux-server-monitoring/
[4] https://gcore.com/learning/linux-system-monitoring-command-line/
[5] https://unix.stackexchange.com/questions/367302/best-good-tool-for-monitoring-a-server-with-web-interface
[6] https://www.linuxjournal.com/content/system-performance-monitoring-and-tuning-guide
[7] https://www.site24x7.com/learn/linux/monitor-linux-server-performance.html
[8] https://betterstack.com/community/comparisons/linux-monitoring-tools/
[9] https://www.ceos3c.com/linux/linux-system-monitoring-essential-tools-and-best-practices/
[10] https://phoenixnap.com/kb/check-cpu-usage-load-linux
[11] https://www.site24x7.com/help/server-metrics/linux-server-monitor.html
[12] https://www.tecmint.com/command-line-tools-to-monitor-linux-performance/
[13] https://serverfault.com/questions/328131/what-metrics-should-i-monitor-on-my-linux-server
[14] https://www.site24x7.com/learn/linux/top-commands-for-sysadmins.html
[15] https://cyberpanel.net/blog/linux-server-monitoring
[16] https://docs.redhat.com/en/documentation/red_hat_enterprise_linux/8/html-single/monitoring_and_managing_system_status_and_performance/index

